

A yacht operational budget is the annual financial plan covering every recurring cost required to keep your vessel safe, legally compliant, and guest-ready. For a 40m–50m new build operated privately at moderate use. Realistic annual operating costs run between a high single-digit and mid-teens percentage of purchase price, not the widely repeated 10% figure that routinely leaves owners underfunded. On a $20M vessel, that gap is $400,000 or more. Crew alone accounts for roughly one-third to two-fifths of annual operating cost, and that share climbs with size. The Superyacht Report OpEx Survey found that a majority of yachts in the 28–83m band report annual operating budgets above $2 million, with owners aboard an average of multiple weeks per year. At Baranofyachts, we build operational budget models from the first design conversation, because the decisions made at the drawing board determine what you spend every year thereafter.
Table of Contents
- What does a yacht operational budget actually cover?
- What do annual operating costs look like by yacht size?
- How do you build and maintain an accurate operational budget?
- How do financing, insurance, and U.S. tax rules affect your budget?
- Key Takeaways
- The cost decisions that matter most happen before the keel is laid
- Baranofyachts: operational budget modeling built into every engagement
- Useful sources for owners who want the raw data
What does a yacht operational budget actually cover?
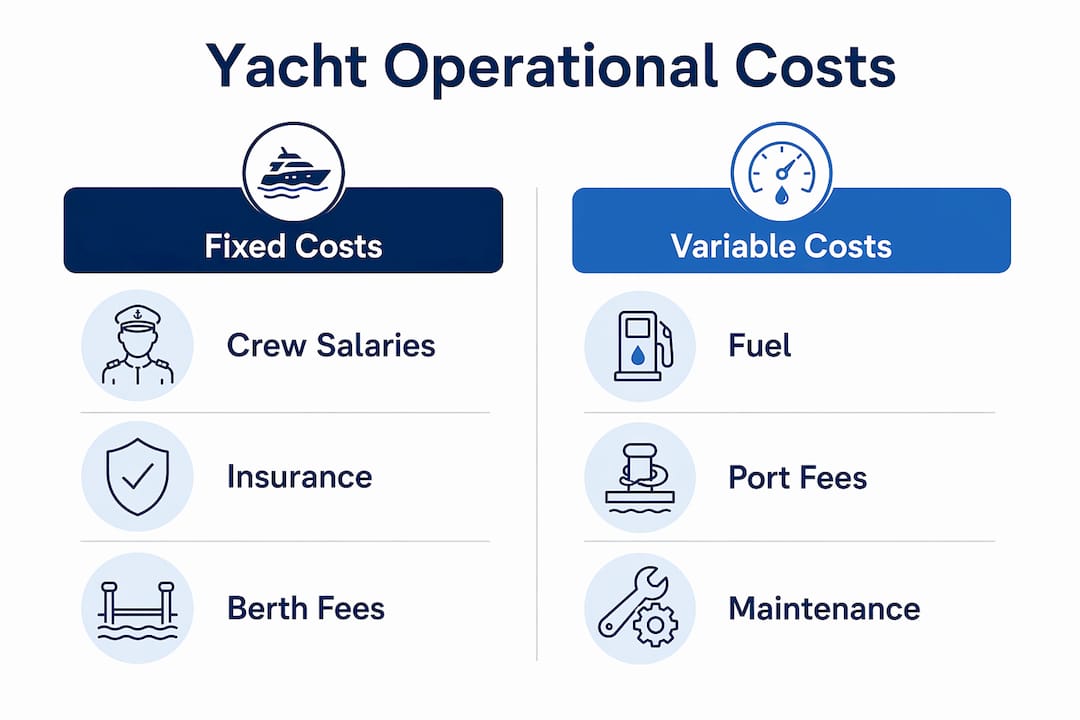
The budget divides cleanly into fixed costs that run year-round regardless of use, and variable costs that scale with cruising hours, charter weeks, and provisioning cycles.
Fixed costs include crew salaries and benefits, insurance premiums, home-berth or marina retainer fees, and management fees. These line items do not pause when the yacht sits idle.
Variable costs include fuel, port fees outside the home berth, provisioning, communications, and discretionary maintenance triggered by use. Charter activity adds crew overtime, accelerated wear, and third-party liability exposure.
Here is how the major categories typically compose annual operating expenditure (OPEX):
| Cost Category | Typical % of Annual OPEX | Fixed or Variable |
|---|---|---|
| Crew (salaries, benefits, travel) | a substantial portion | Fixed (base) + Variable (overtime) |
| Maintenance & refit reserve | a significant portion | Mixed |
| Insurance (hull, P&I, crew medical) | an important portion | Fixed |
| Berthing / marina fees | a moderate portion | Mixed |
| Fuel | a variable portion | Variable |
| Management fees | a smaller, but meaningful portion | Fixed |
| Provisioning & communications | a part of variable costs | Variable |
| Contingency | a recommended reserve | Reserve |
Two drivers move nearly every line item: vessel size and usage intensity. A 50m hull with a full-time crew of nine costs materially more to staff than a 40m with six, even at identical cruising hours. Older vessels carry higher maintenance exposure because aging subsystems create knock-on effects across electrical, hydraulic, and propulsion systems. Home berth geography matters too: U.S. East Coast marina rates and labor costs differ from Mediterranean or Pacific Northwest bases.
The refit reserve deserves special attention. Most practitioners recommend accruing 1.5–2% of vessel value annually into a dedicated reserve account, separate from the operating P&L, so that a scheduled five-year refit does not arrive as a cash crisis.
Pro Tip: Crew stability is one of the most underestimated cost levers in yacht ownership. High turnover triggers recruitment fees, visa and travel costs, and a learning curve that increases fuel burn and maintenance errors. Investing in competitive compensation and clear rotation schedules often reduces total OPEX more reliably than cutting provisioning budgets.
What do annual operating costs look like by yacht size?
The table below uses U.S.-dollar figures and reflects moderate private use. Charter-active vessels should add 15–25% to fuel, provisioning, and maintenance lines.
| Size Band | Est. Purchase Price | Annual OPEX (Moderate Use) | Annual OPEX (Charter-Active) |
|---|---|---|---|
| 40m–50m | $8M–$15M | — | — |
| 40–50m | $15M–$25M | — | — |
| 50m | $25M–$45M | — | — |
| >50m | $45M+ | $2M+ | — |
Worked example 1: 45m motor yacht, moderate private use
A $20M, 45m motor yacht produces a realistic annual running cost of approximately $1.85M, broken down as follows:
- Crew (captain + 8 crew): $760,000
- Insurance (hull & machinery, P&I, crew medical): $310,000
- Fuel (600 engine hours): $235,000
- Dockage (home berth + port fees): $215,000
- Refit reserve (accrual): $200,000
- Management fees: $130,000
- Provisioning & communications: $75,000
- Contingency (5%): $93,000
This real-world P&L breakdown aligns with the 12–15% of purchase price range for a well-maintained, privately operated vessel.
Worked example 2: 50m charter-active hull
Add a structured charter program to the same size class and the picture shifts. Fuel consumption rises with back-to-back charter weeks, crew overtime becomes a recurring line, and accelerated wear moves the maintenance accrual upward. Charter revenue can offset a meaningful portion of OPEX, but ROI outcomes vary widely: carefully selected vessels in well-managed programs can deliver 10–18% ROI, while unoptimized programs typically produce 0–5%. Charter income is a strategy, not a guarantee.
Depreciation sits outside the OPEX line entirely. It is a capital consideration, not a running cost, but it affects the percent-of-purchase math as the vessel ages.
How do you build and maintain an accurate operational budget?
A well-constructed budget follows four stages, each feeding the next.
-
Define your usage profile. Decide how many weeks per year you plan to use the vessel, whether you intend to charter, and which cruising areas you will operate in. These three variables set the scale of nearly every downstream cost. Owner usage below a threshold that ranges around a few months per year often makes a fractional or charter-access model more cost-effective than full ownership.
-
Build a line-by-line baseline. Collect actual quotes from management companies, insurance brokers, and marinas. Use practitioner salary benchmarks: a captain on a 50m yacht commands €10,000–€16,000 per month; on an 80m, €16,000–€23,000 per month. Generic rule-of-thumb figures are starting points, not budgets.
-
Set reserves and define KPIs. Fund the refit reserve as a separate account from day one. Track three core KPIs monthly: OPEX versus budget (%), refit reserve funded percentage, and crew turnover rate. These three metrics tell you whether the budget is holding or drifting before a shortfall becomes a crisis.
-
Implement a monitoring cadence. Monthly P&L reconciliation against actuals, a quarterly forecast re-run, and a 12-month rolling cash plan tied to known milestones (annual class surveys, scheduled refits, flag-state certificate renewals) keep the budget a living document rather than a one-time estimate.
Professional yacht management strategies make sense when the vessel exceeds 40m, when you are running a charter program, or when you lack an experienced captain who can also manage vendor relationships. Full management fixed fees vary widely per year; percentage models typically represent a few percent of OPEX on larger yachts. When engaging a manager, ask for a sample monthly P&L format, their refit-vendor network, and their crew-placement track record.
Pro Tip: Ask any prospective management company for three years of actual OPEX data on a comparable vessel they currently operate. Projected budgets are easy to produce; historical actuals reveal how well they control costs under real conditions.
How do financing, insurance, and U.S. tax rules affect your budget?
Capital structure changes cash flow before the vessel ever leaves the dock. A marine loan at current rates adds a fixed monthly obligation that must be funded regardless of how many weeks you use the yacht. Loan covenants often require specific insurance minimums and survey intervals, which creates predictable but non-negotiable budget spikes. Yacht financing structures vary significantly in how they treat balloon payments, interest-only periods, and cross-collateralization, each of which affects your annual cash cushion requirement.
Insurance is one of the few OPEX lines where owner decisions directly control cost. Hull and machinery premiums typically run 0.75–1.5% of insured value annually, though claims history, itinerary (offshore passages versus coastal cruising), and crew certification levels all move the rate. P&I coverage and crew medical add further layers. A comprehensive insurance strategy reviewed annually by a marine specialist prevents both underinsurance and premium overpayment.
U.S. tax note: Business-use justification, capitalization versus expensing decisions, and state sales/use tax exposure (which varies by flag, state of delivery, and operational pattern) can materially affect the after-tax cost of ownership. Consult a qualified maritime tax attorney before finalizing your ownership structure. This article is general information, not tax or legal advice.
Compliance timing creates predictable budget spikes that owners frequently underestimate. Annual class surveys, USCG documentation renewals, and flag-state certificate cycles all land in specific calendar quarters. Map these dates into your 12-month rolling cash plan at the start of each fiscal year.
Key Takeaways
A yacht operational budget built on realistic usage assumptions, funded reserves, and monthly monitoring is the single most reliable way to protect both the vessel and the investment behind it.
| Point | Details |
|---|---|
| Use 12–15%, not 10% | For a 40m–50m new build at moderate use, budget 12–15% of purchase price annually. |
| Crew is the dominant line | Crew salaries and benefits typically represent 30–40% of total annual OPEX. |
| Fund the refit reserve separately | Accrue 1.5–2% of vessel value per year into a dedicated reserve account, outside the operating P&L. |
| Charter income requires active management | Carefully selected vessels in well-managed programs can deliver 10–18% ROI, while unoptimized programs typically produce 0–5%. |
| Baranofyachts integrates budget modeling into project management | Operational cost planning begins at the design stage, not after delivery. |
The cost decisions that matter most happen before the keel is laid
Most operational budget conversations happen after a yacht is delivered, when the costs are already influenced by the choices made during design and build. That is the wrong sequence. The systems you specify, the crew quarters you plan, and the propulsion architecture you select all have direct, measurable consequences for what you spend every year for the next decade.
We have seen owners save materially on long-term OPEX by standardizing mechanical systems across a build, which reduces spare-parts inventory and shortens repair windows. Crew rotation planning built into the accommodation layout reduces fatigue-related errors and turnover. These are not abstract efficiencies; they show up in the monthly P&L.
The 10% rule persists because it is simple, though its accuracy is questionable. For a new-build buyer or a corporate client structuring a vessel as a business asset, treating it as a budget ceiling rather than a floor is a planning error with compounding consequences. The owners who manage OPEX most effectively are the ones who stress-test their assumptions before signing, not after.
Baranofyachts: operational budget modeling built into every engagement
For corporate clients and private buyers who want certainty before committing, Baranofyachts provides bespoke operational budget modeling as part of every project management engagement. You receive a line-by-line annual cost model, a refit reserve schedule, a risk register tied to vessel age and complexity, and a project timeline that maps compliance milestones to your cash plan.
We work with you from the earliest design conversations through delivery and into the first years of ownership, so the budget you plan is the budget you actually live with. Whether you are evaluating a brokerage purchase, planning a custom build, or restructuring an existing vessel’s operations, our team brings the same conductor’s-eye discipline to cost planning that we apply to every build milestone. Contact Baranofyachts to schedule a consultation and receive your initial operational budget model.
Useful sources for owners who want the raw data
- First Owner’s Reference: The most practitioner-grounded source on the 10% rule’s limitations, crew salary benchmarks, and realistic OPEX ranges by size. Start here for salary data and the 12–15% planning range.
- Yachtpedia running costs: Cost ranges by vessel class for 2025–2026, useful for cross-checking absolute-dollar estimates against European market data.
- Turquoise Marine Systems charter ROI analysis: The most rigorous publicly available treatment of charter ROI scenarios; use it to stress-test charter-income assumptions before committing to a program.
- Seven Docks Yacht Investment Calculator: A configurable tool for modeling charter revenue, ROI, and payback periods using your own utilization and cost assumptions.
- Anacortes Yacht Charters ROI Calculator: U.S.-based charter ROI tool that incorporates moorage, maintenance, and commission splits; useful for Pacific Northwest and coastal U.S. charter scenarios.
Recommended
Sold Listings
Design Your Yacht
"*" indicates required fields
Maximus III - PNW
As you step aboard MAXIMUS III, the first impression is her scale.
At 120 feet with an 8-meter beam and 294 GT of interior volume, this 2025 Crescent Custom tri-deck immediately feels open, balanced, and estate-like. A timeless look while still feeling fresh from the shipyard.
Currently Available


Get your yacht value Estimate
"*" indicates required fields